This particular use case represents an ongoing collaboration between two partners of the project: Eraneos and LEAG. As a work in progress, it embodies the combined efforts and expertise of both entities, showcasing their dedication to advancing the project’s objectives.
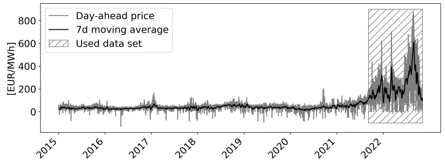
Description: Powerplant facilities are constantly faced with ramp up or ramp down decisions due to prioritized renewable energies. Future electricity prices must be available several days ahead, as coal power plants are inert. Electricity prices fluctuate due to geopolitics, unplanned outages and increasing share of renewables. Competitors offer just blank predictions without any model description or explaniability.
Impact: Power plants operators can prepare for ramp-up and ramp–downs in a timely, data driven and objective manner to increase operational efficiency. Demand for fossil fuels can be estimated and scheduled as well as CO2 emission are potentially reduced.
Current status: The Machine Learning development is done, and results are presented in a scientific publication.
Models are deployed and predictions are automatically calculated on a daily basis.
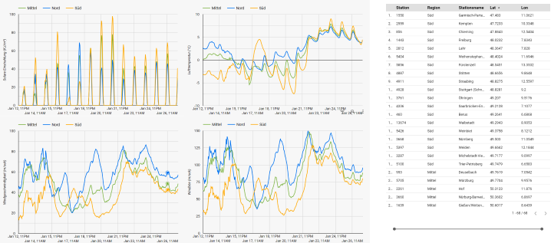
User Interface
A first version of a dashboard has been developed for the use case provider LEAG. Interactive diagrams allow the user to conduct deep data analysis and inspect specific time periods.
In addition to that, the feature importance is shown on a global, we hereby mean a model-wide and time independent, level. This reveals which factors influences the most.
ML Model Summary
The German day ahead electricity price is forecasted by several machine and deep learning models. A so-called LSTM-model, an artificial neural network specialized on time series data, as well as tree-based models, which are robust against overfitting, were developed.
Tuning and optimizing their performance has turned out to be difficult as a data and concept drift can be observed in the data
Explainer Component Overview
As forecasts come with a time as well as model dependent error, the dashboard user had had difficulties in deciding how much electricity should be generated.We therefore haven taken advantage of the model structure and estimated a margin of error that varies over time.
A non-symmetrical lower and upper boundary give insight of possible price ranges. Thus, the user can better evaluate different scenarios.
Feedback Component Overview
The dashboard user has very limited time as there is less than one hour between calculating predictions and giving bids on the EEX.Therefore, the feedback components should take as little time as possible. At the same time, they should be as informative as possible.
We have proposed 5 questions with pre-defined options. They mostly deal with the prediction quality and its likelihood.