UC 1.2 Operator Support / Anomaly detection
The development of this use case is currently underway through the collaborative efforts of two project partners: LEAG and ABB. As they continue to refine and enhance their contributions, this ongoing partnership highlights the commitment of both organizations towards achieving the project’s goals.
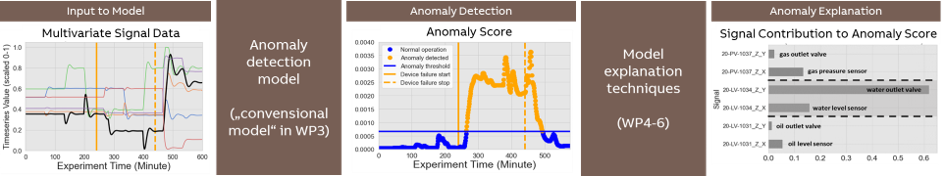
AI-based anomaly detection models have the potential to uncover unusual plant situations to operators, that are hidden and could go easily gone unnoticed. A common limitation of anomaly detection is the lack of explainability of the AI black box models, as well as the lack of known historic anomalies (labeled data) when building these models.
To overcome this problem, this use case aims providing more robust and comprehensive anomaly detection systems for plant operators, with the help of interactive XAI-based anomaly explainers.
Impact: A comprehensive anomaly detection and root-cause analysis will allow users to better investigate the given situation, and hence, take better actions.
On the other hand, the ML system will benefit from the more informed user feedback, by having correct labels, which are used to continuously improve the robustness of ML models.
Current status: ML pipeline in place to build anomaly detection models on LEAG data, including data preprocessing and feature selection steps.
First anomaly detection models developed for historic LEAG time series data, and validated againt known LEAG alarm situations.
User Interface
In 2023 a first version of a dashboard has been developed with LEAG, which allows operators to detect anomalies and explore their root causes explains the anomalies.

ML Model Summary
The anomaly detection is based on a generative AI-based model, which is a neural network autoencoder.
Natural language techniques are employed, e.g. to summarize a given anomaly in textual form in the language of the human user.Various AI-based techniques have been developed to explain a given anomaly in the sense of XAI.
Anomaly detection and explanation has been implemented and tested using real plant data provided by LEAG, and the dashboard has been evaluated with several LEAG plant operators.
Explainer Component Overview
Serveral novel concepts have been developed in our dashboard to explain a given anomaly including:A generated textual summary of the given anomaly, to explain the anomaly to the user in natural lanuage.
A visualization that explains which devices contributed most to the given anomaly and could therefore be its root-cause (e.g. due to a device malfunction)
Feedback Component Overview
When an anomaly is presented to the user in the dashboard, the user shall have the possibility to give feedback to this anomaly.
Fur the purpose of explaining similar anomalies to the end user, a feedback concept has been implemented, which allows the user to give textual annotations to a given anomaly (similar to an electronic operator shift book entry), e.g. „After visual inspection by a service technician, it turned out that this anomaly was caused by the valve V1234 that was stuck. The error was fixed“. The user annotations are saved, and when a similar anomaly happens again in the future, these user annotations are very insightful to find out what was the root-cause in very similar anomalies in the past and how they were fixed.
For the purpose of continuous model improvement (CMI) e.g. by the data scientist or automatically (AutoML, etc.), a feedback concept has been realized to allow users to label a given anomaly as true or false. The determination of similar anomalies, which is possible in our dashboard, could be used for automatic label propagation of user labels to other similar anomalies, so that not every anomaly would have to be labeled manually.