Södra and Viking Analytics are working together on this specific use case. They’re improving its features and finding new ways to use it. Their teamwork shows how committed they are to making progress and coming up with new ideas.
Södra currently has hundreds of vibration sensors deployed. There is potential value in predicting failures or irregularity based on the vibration monitoring data (especially given Viking’s expertise in the domain). In addition to a simple prediction, understanding the correlation between various factors could enable maintenance professional to identify patterns and foresee potential challenges. Assets: Motors, gearboxes, pump, fans.
Process Sections: Boiler, Wash press (Tvätt press)
Impact: Shutdown of process section, problems propagating downstream, reduced efficiency, reduced throughput, increased wear and tear due to deposits
Desired Outcomes: Assist data engineers to answer the following questions:
When will an asset fail?
Why will the asset fail? Which component is failing?
Can we run the next X weeks without problem?
Impact of an intervention (e.g. reduce speed) on vibration?
What-if analysis: Decision support with an effect on how to resolve the issue.
Data: Currently a few online vibration monitoring and many offline vibration monitoring system exists. Online sensors provide data in a second sampling rate, the data from offline sensors is collected at intervals of 4-12 weeks. For extended use cases, access to operator actions (audit trail) and process values will be required.
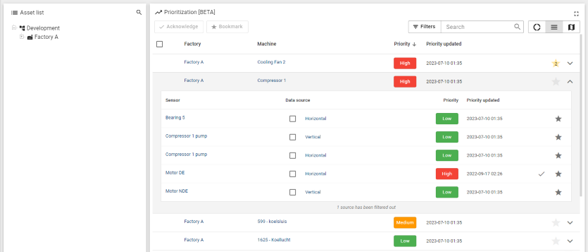
User Interface
The asset prioritization provides an ordered list of machines that needs expert attention. This enables Vibration expert to focus on the assets which are demonstrating most worrying signs of change that need to be further investigated.
ML Model Summary
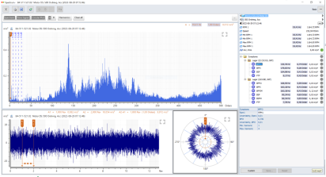
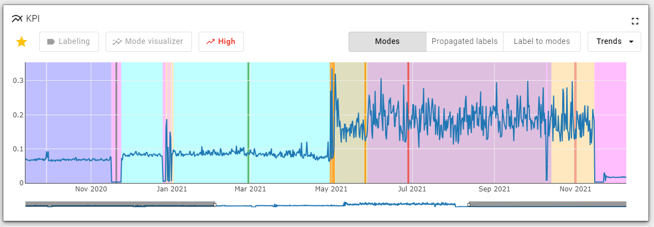
Viking Analytics ML model automatically identifies operation behavior by analyzing the raw vibration data. The visualization below shows different operation modes with different colors as identified by the ML model.
The vibration expert is alerted when a new “behavior” has been identified specially if it is combined with increase in the energy.
Explainer Component Overview
Additional information is provided to enable the user to quickly learn about the event. For example, the type of the event (emerging mode), when it has occurred (timestamp of the measurement) and energy level of the measurement (i.e. RMS information).
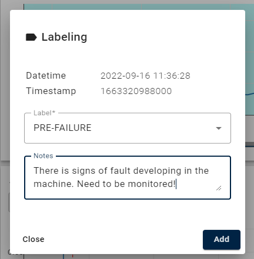
Feedback Component Overview
The user (i.e. vibration expert) is able to label timestamps to provide additional information about its findings. The label provides contextual information to the data and helps the ML model to provide more informative alerts in the future.